Análisis y proyección económica del fracking a nivel mundial
A finales del 2013, empezó a leerse más en las redes sociales sobre los efectos negativos del fracking sobre el medio ambiente, véase Energía: Estados Unidos y el "fracking".
Pues hoy les traigo un análisis y proyección sobre el gas/petróleo shale -que se extrae a través del fracking del EIA (US Energy Information Administration): Technically Recoverable Shale Oil and Shale Gas Resources: An Assessment of 137 Shale Formations in 41 Countries Outside the United States.
El análisis se encuentra en inglés, pero es muy completo y muestra datos como:
- Comparison of the 2011 and 2013 reports
- Technically recoverable shale oil and shale gas unproved resources in the context of total world resources
- TERMINOLOGY: SHALE OIL AND TIGHT OIL
- Top 10 countries with technically recoverable shale oil resources
- Top 10 countries with technically recoverable shale gas resources
Además, se puede leer el resumen (descargalo también), descargar el estudio completo o por grupos de países (Chapter breakdowns by country):
- I-III - Canada, Mexico, Australia
- IV-VII - N. South America, Argentina, Brazil, Other S. South America
- VIII-XIII - Poland, Russia, Eastern Europe, United Kingdom, Spain, Northern and Western Europe
XIV-XIX - Morocco, Algeria, Tunisia, Libya, Egypt, South Africa - XX-XXVI - China, Mongolia, Thailand, Indonesia, India/Pakistan, Jordan, Turkey
A continuación, uno de los gráficos que se desprenden del análisis, que muestra las regiones donde existen asentamientos de gas/petróleo shale alrededor del mundo:
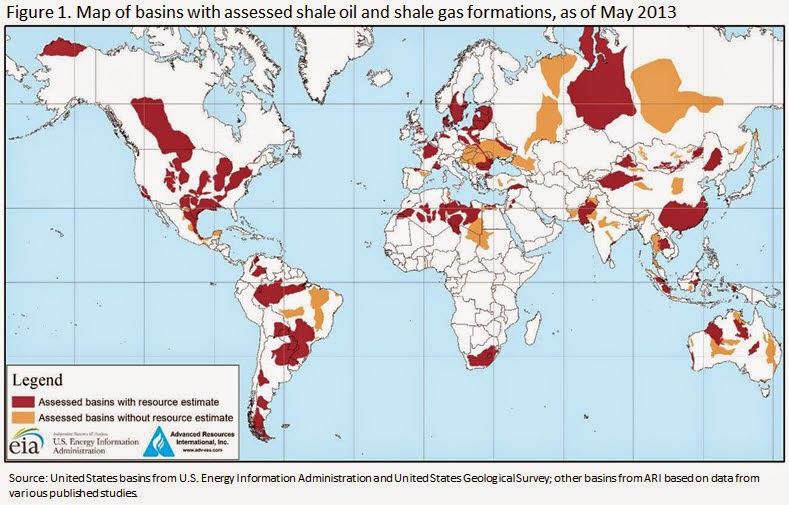
- Red colored areas represent the location of basins with shale formations for which estimates of the risked oil and natural gas in-place and technically recoverable resources were provided. Prospective shale formations rarely cover an entire basin.
- Tan colored areas represent the location of basins that were reviewed, but for which shale resource estimates were not provided, mainly due to the lack of data necessary to conduct the assessment.
- White colored areas were not assessed in this report.
Finalmente, interesante reflexión sobre la situación de Europa frente al fracking: Can Europe compete with a fracking-fuelled US?
Newspapers like to claim that energy prices are much higher in Europe than in the United States, which has embraced fracking, and that this is killing the competitiveness of European industry. But this alarmist view is only partially true; and before all else, let’s distinguish between the three major types of energy and consider how these feed into the debate.
- The price of oil is the same all over the world. Prices vary only because of local taxes or subsidies.
- Power (electricity) costs vary enormously from country to country and even from sector to sector. Some data from the International Energy Agency (IEA) suggest that the EU average is almost twice as high as that in the US. But more detailed studies show that in some highly power-intensive sectors, at least in north-western Europe, costs are similar to those in the US. The horrendous cost of renewables is paid mainly by surcharges on households.
- Gas: here again prices vary across countries, but the US level seems to be about one third of the average across the EU and is likely to remain cheaper for quite some time.
Solo destacar, que es verdad que el precio del petróleo es el mismo en todo el mundo, la diferencia de lo que se paga por el combustible se debe a los impuestos o subsidios según sea el caso en cada país.

Comentarios